1. Functional Specification
1.1. Introduction
The Dispense Monitor System (DMS) monitors the performance of a commercial 8 channel microliter fluid dispenser to detect dispense faults. The DMS consists of an optical head that collects a linear (1D), 1 kHz video of the shadows of eight dispense streams backlit by a collimated laser sheet. It receives configuration and timing information from the host dispenser, and returns fault detection information.
1.2. Interface
The DMS communicates with a host computer by simple commands over a USB interface. The host sets configuration parameters such as fluid stream diameter and number of dispensed wells per plate, then sends a command to monitor a dispense. The DMS automatically monitors the next plate dispense that occurs and computes fault detection results. The host can then request those results prior to monitoring a new dispense.
1.3. Fault Detection
The DMS is designed to detect deviations from normal dispense dynamics in individual fluid streams. Such deviations are likely the result of a clog, bubble, particulate contamination, depleted fluid reservoir, or other factor that will ultimately degrade dispense performance and perturb assay results. Such perturbations may include incorrect dispense volume, atypical fluid placement within the well, or other subtle factors like entrained air or atypical fluid mixing.
The DMS essentially monitors the time-resolved diameter and lateral position of each fluid stream. It does not monitor the velocity of the fluid, so it cannot directly measure dispensed volume. Thus, the DMS cannot quantify either absolute dispense volume or variation in relative dispense volume among wells on a plate. DMS data should never be interpreted in this way.
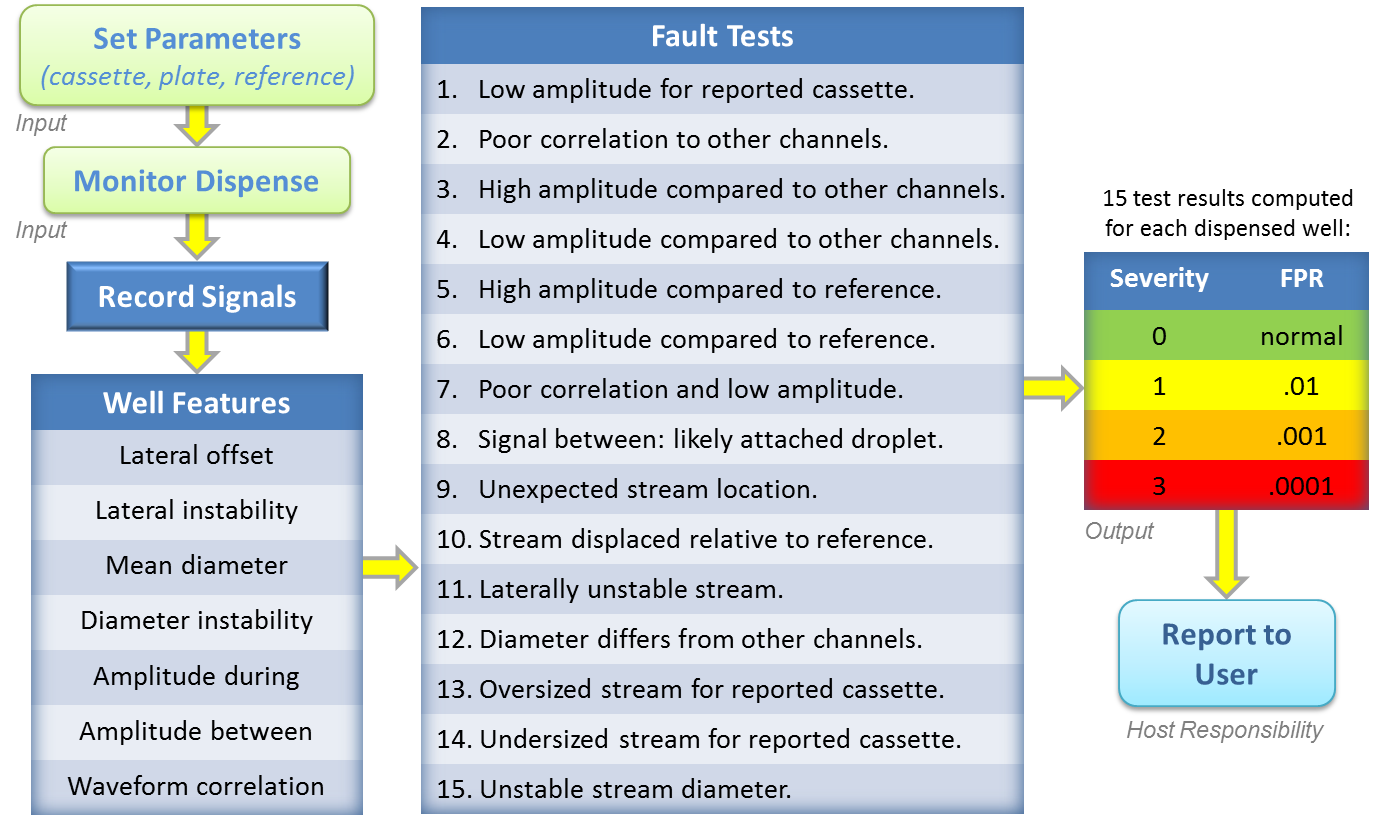
A schematic of the fault detection process is shown in Fig. 1.1. First, the host computer sends several parameter values to the DMS, including the nominal stream diameter (cassette size), the numbers of wells to be dispensed (plate type), and the reference mode, then sends a command to monitor the next dispense. The DMS automatically monitors dispense dyanmics by collecting three time-domain signals related to stream diameter and lateral position, computing a series of nine scalar features from these signals for each well, and finally conducting 15 fault tests for each well by comparing the features to a pre-defined set of fault thresholds. The results of these 15 tests are reported to the host.
Each fault test corresponds to a well-defined physical effect as tabulated in Fig. 1.1 above. The following definitions clarify the meaning of these fault descriptions:
- amplitude
- The total fraction of light blocked by the fluid stream for a particular channel, averaged over the duration of a well dispense. This metric effectively takes into account both the diameter and nominal duration of the dispense stream for a given well.
- lateral offset
- The displacement of a stream from its expected location relative to the other streams in the cassette.
- diameter
- A direct measurement of the stream diameter based on the geometry of its shadow. Unlike signal, this metric is only calculated while a stream is actually present, and is not affected by its duration.
- correlation
- A normalized metric that measures how similar the dynamics of one channel are to another over the duration of one well dispense.
- during
- The time period that the pump is running and a stream is normally present for a well dispense.
- between
- The time period between well dispenses when the pump is not running and no stream is expected to be present.
The result of each fault test is a severity in the range of 0-3 as tabulated in Table 1.1. The severity levels are roughly quantified in terms of false positive ratio (FPR), or the probability that the fault indication might occur for a normal, good dispense. A ‘notice’ might be expected to occur once in each 100 normal dispenses, and thus one or a few notices on a 96 well plate would probably not be cause for concern. However, if a notice occurs frequently on a particular channel, this may indicate a real issue that needs attention. An ‘alert’ is only likely to occur once in 10,000 normal dispenses, so even on a 1536 well plate, one alert is likely to be meaningful.
| Level | Description | FPR |
|---|---|---|
| 0 | normal | – |
| 1 | notice | 0.01 |
| 2 | warning | 0.001 |
| 3 | alert | 0.0001 |
1.4. Fault Thresholds
The fault tests tabulted in Fig. 1.1 are designed to compare the dispense features to normative thresholds based on one of three sources:
A pre-defined absolute value. This allows the DMS to detect gross errors such as an incorrect cassette size. This type of comparison is only possible for values that are well-defined in advance of a dispense, such as nominal stream diameter.
The median value among other wells or channels on the current plate. This allows the DMS to catch individual well dispenses or channels that look different from others on the plate. This type of comparison is very robust because it is insensitive to the cassette size, dispense protocol, fluid properties, etc.
A reference value based on either:
- a validated reference dispense designated by the user or
- the median value from a few of the preceeding plate dispenses.
This allows the DMS to catch changes in the dispense dynamics that occur over time, again in a robust way that does not require knowledge of the cassette size, dispense protocol, fluid properties, etc.
We have conducted extensive testing to set the values of these fault thresholds for the BioTek 1 and 5 uL steel/sapphire tipped cassettes. We expect these values to remain constant and valid for all dispense protocols and fluids dispensed using these cassettes. It should be unnecessary for an end-user to change or even be aware of the value of these thresholds.
1.5. Reference Mode
The DMS can be operated in one of two reference modes, either ‘user’ or ‘history’. These determine which of the two possible references sourses listed in item 3 above are used. In ‘user’ mode, the user conducts an initial dispense, validates it (visual check, gravimetric, optical, etc.), then designates that dispense as the reference that all subsequent dispenses are compared to. This ensures that all new dispenses are compared to a known reference that does not drift with time.
For simpler (and typically equally reliable) operation, the DMS can be operated in ‘history’ mode. In this mode, the DMS automatically maintains reference values based on the median of the last few dispenses (10 by default). This typically works quite well, and is transparent to the user. However, it is theoretically possible for a hypothetical slow drift in the dispense dynamics to go undetected. It is also important that the history be cleared anytime the cassette or dispense protocol is changed in any way.
1.6. Subtleties
Dispense Rhythm. It should be noted that, particularly for small (1 uL aliquot) cassettes, dispense dynamics can be quite sensitive to dispense rhythm. If the dispenser is allowed to sit idle for a few minutes, the next dispense is likely to produce alerts. These will often resolve after a few plates are dispensed in quick succession. This effect may be due to small bubbles that form in the dispense lines, relaxation in the peristaltic pump tubing, or a change in the meniscus or attached droplet that forms at the nozzle tip due to deposits resulting from evaporation.
Cassette Type. The DMS has been developed with 1 and 5 uL steel/saphire tipped cassettes. Use with other styles of cassette may require new validation studies.
Laser Distance. The DMS fault detection is somewhat sensitive to the distance of the laser sheet below the dispense tips. When the laser sheet is very near the tips, attached droplets that form on the tips have greater influence on the results. If a large attached droplet forms and persists between plate dispenses, it can even prevent the DMS from acquiring a clean background image immediately prior to the next dispense, causing a software error flag to be thrown. On the other hand, when the laser sheet is adjusted further from the tips, the apparent lateral displacement of angled streams is magnified, and surface tension effects can cause the stream diameter to be more variable.
In order to accommodate minimum clearance between the dispense tips and the top of the well plate, the DMS development and validation studies have been conducted with the laser sheet grazing the dispense tips. If this causes problems for a particular user or protocol in the future, it is possible to consider adjusting the laser sheet distance. However, this would likely change the fault detection sensitivity, and may require new fault thresholds and validation studies.
1.7. Testing Results
Note
This section is in progress and will be revised after new rounds of testing at Creare and BioTek are complete.
For the purpose of validating DMS detection results in a quantitative way, we define a true fault as follows:
- CV
- Coefficient of variation for dispense volume specified by manufacturer of dispenser (𝜎/𝜇).
- True Fault
- The volume dispensed into a single well deviates from the median value within the plate by more than 3.9 times the specified CV. Assuming a Gaussian distribution, we expect fewer than 1 in 100,000 normal dispenses to exhibit such a deviation.
We then dispensed many wells using different cassettes and dispense volumes while monitoring with the DMS. We also quantified the true dispensed volume in each well with an absorbance plate reader. We used this data set in two ways: first, to characterize the normative DMS feature distributions among all good dispenses and establish fault thresholds based on Table 1.1; and second, to quantify the true fault detection confidence that was achieved by applying those thresholds.
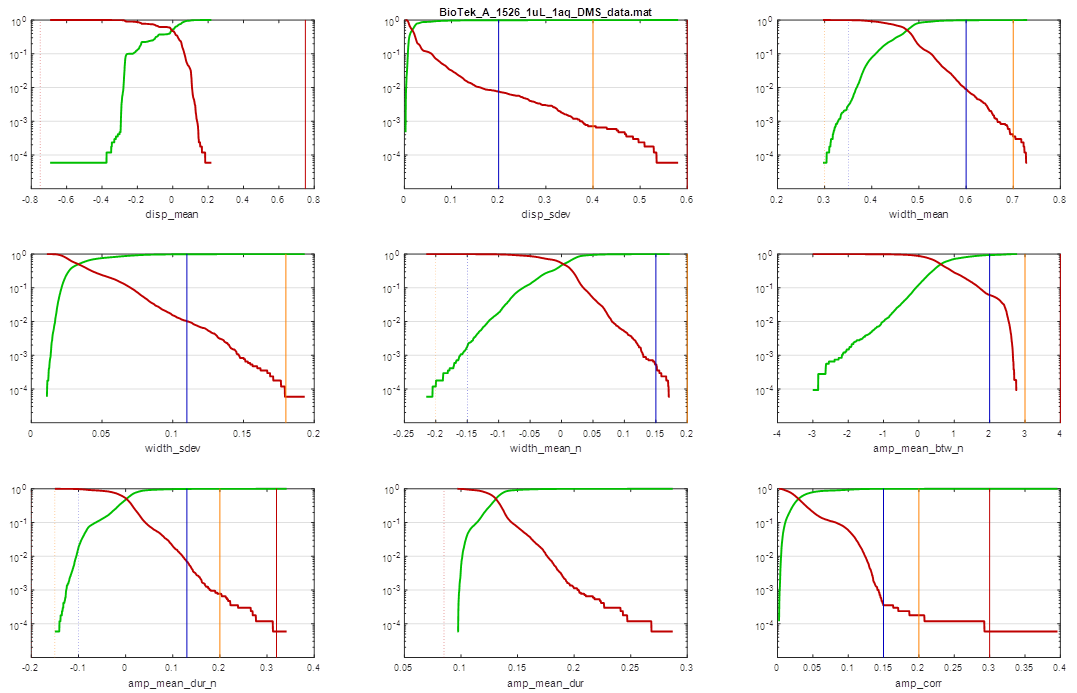
Feature Distributions. We compiled the feature distributions for all non-fault wells as shown in Fig. 1.2. Each of these plots shows two cumulative distribution functions, one ascending (red) and one descending (green). To understand these plots, look at the upper-right plot, for the width_mean feature. Looking at the red curve, this feature has a 1% (.01) probability of taking on a value above 0.6. Looking at the green curve, this feature has a 1% probability of taking on a value below 0.37. The vertical lines indicate our fault detection thresholds, with blue, orange, and red indicating notice, warning, and alert respectively. Dashed lines indicate lower bounds, and solid lines indicate upper bounds.
These feature distributions will vary somewhat with each experiment. But in general, for a large population of ‘good’ dispenses, we’re shooting for a false positive ratio (FPR) of about .01, .001, and .0001 for ‘notice’, ‘warning’, and ‘alert’ respectively. Thus, the red distribution curve should typically cross the solid blue threshold at a probability of about .01, the solid orange at about .001, and the solid red at about .0001. Similarly, the green distribution curve should cross the dashed thresholds at about the same values.
Note that we have not defined all three thresholds for all the fault tests, and we have not always adhered strictly to the .01, .001, and .0001 target levels. These choices are based on our best judgement of what is most likely to be useful in practice.
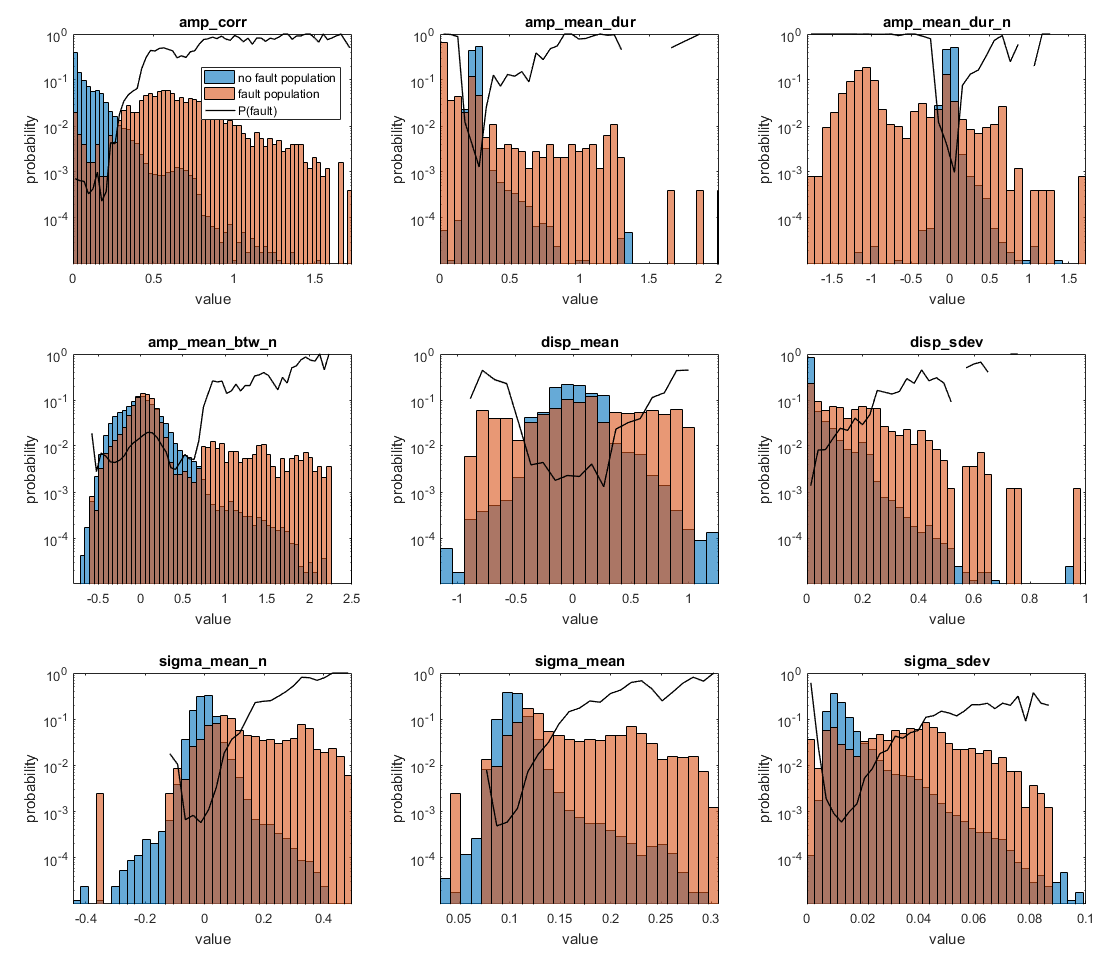
Detection Confidence. We compared the DMS detection results to the true faults identified by the absorbance plate reader. Fig. 1.3 shows the feature distributions for both the no-fault and fault dispense populations, while the black curve indicates the probabability that a dispense with a given feature value is a fault. The regions of these distributions most likely to be useful for fault detection are those that both have a high fault probability and contain a significant fraction of the fault population. Examples would be the first plot (for the amp_corr feature) at values above 0.4 or the upper-right plot (feature amp_mean_dur_n) at values below -0.3.
Given the feature distributions observed in this test of 170,000 wells, the DMS achieved the fault detection results tabulated in Fig. 1.4. We would expect similar results in most real-world scenarios.


